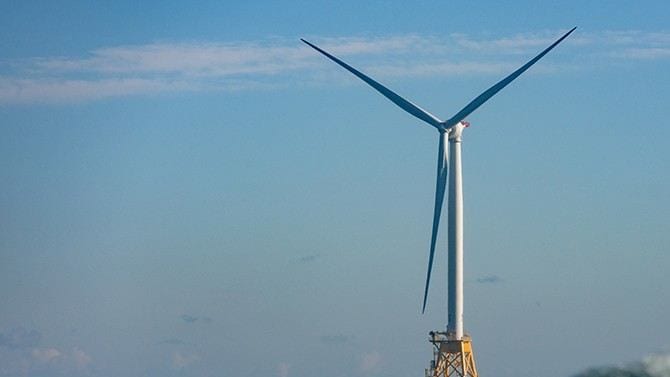
The future of energy
The Center for Research in Wind (CReW) at the University of Delaware fosters interdisciplinary and collaborative scientific research; engages decision makers, industry and civil society and acts as an “honest broker” among them; and enhances the education of the present generation of students with the goal of facilitating the transition to power generation using carbon-free geophysical flows, particularly wind power.
CReW is administratively a part of the College of Earth, Ocean and Environment (CEOE), but is pan-University in focus and faculty affiliation, including engineering, business and wildlife conservation.
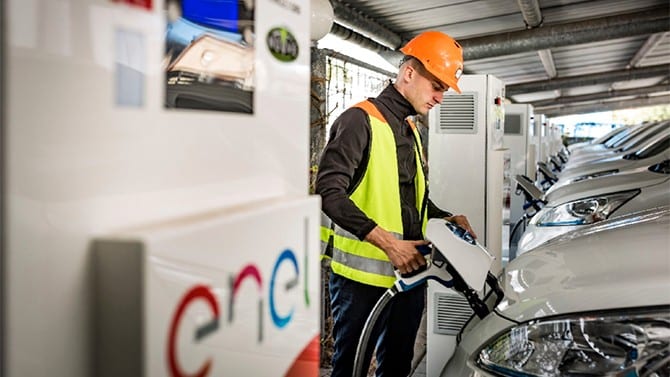
VEHICLE-TO-GRID (V2G)

Highlights from CReW’s key research, events, education, community outreach and more are featured in our annual year-in-review publication. Learn more.

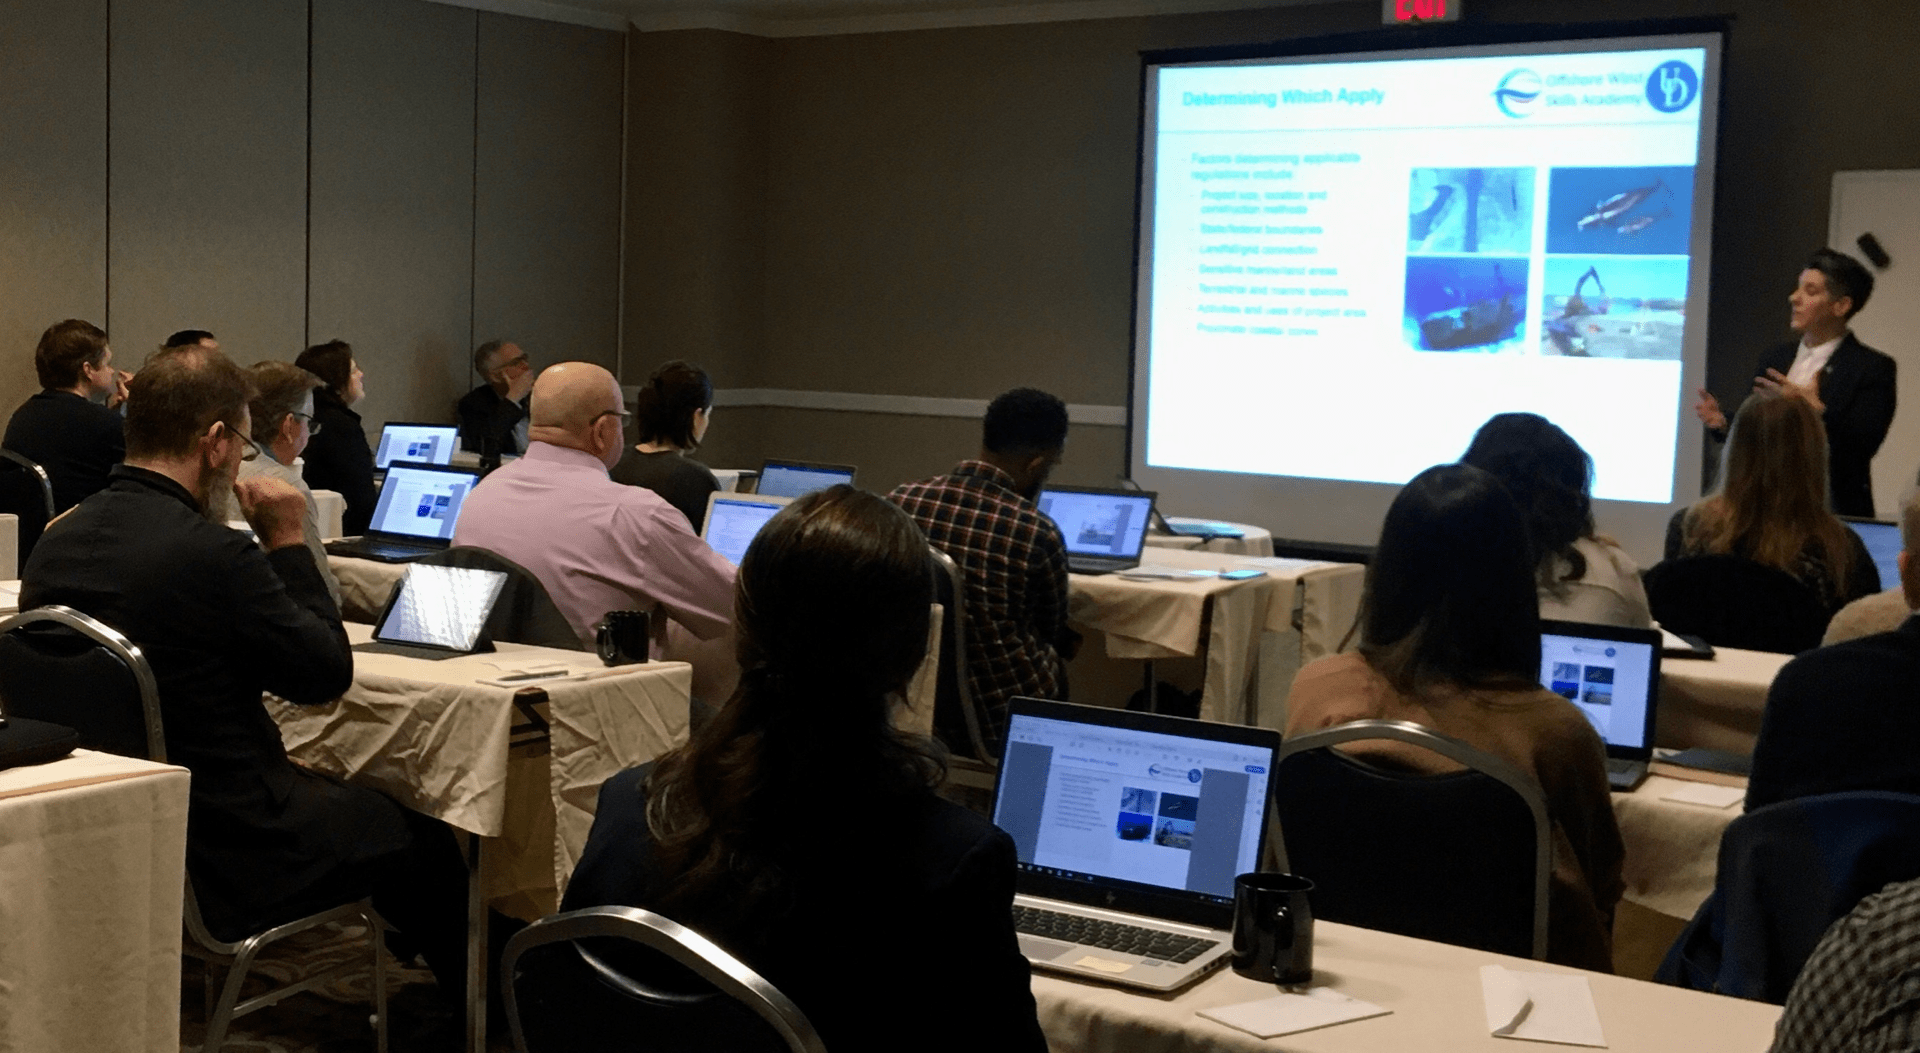
Power your education
